Geography & Scale (GPY 200 intro)

What geography is, the eight questions, and the state-vs-county scale effect.

This is a general-education intro deck for GPY 200, not direct material for the GPY 370 Remote Sensing final. Included for completeness — the cartographic-scale point on slides 8–10 is useful background for the Landsat/MODIS/AVHRR resolution-trade-off discussions elsewhere in the course.

Jump to

#1 #2 #3 #4 #5 #6 #7 #8 #9 #10
slide 1

What is Geography? — title

Likely answer edit

What is geography? — lecture title. An intro deck from GPY 200 (general education geography), included here for completeness. Not directly on the GPY 370 RS final, but useful context for cartographic scale (slides 8–10).

slide 2

Definition of geography

Likely answer edit

Definition of geography.

  • A branch of science concerned with how and why things are distributed over the earth and how the patterns of distribution have changed over time.
  • Focus: place and space.
  • Empirical, quantitative discipline that follows the scientific method.
  • Sometimes called the “spatial science.”
slide 3

Eight geographic questions

Likely answer edit

Eight geographic questions — the framework.

  1. What is there?
  2. What is its extent?
  3. How much is there?
  4. Why is it there?
  5. Why isn’t it elsewhere?
  6. Where could it be?
  7. Was it there in the past?
  8. Will it be there in the future?

Any serious geographic investigation can be framed as one or more of these.

slide 4

Four main areas of emphasis

Likely answer edit

Four main areas of geography.

  • Cultural (Human) Geography — people, societies, cultures.
  • Physical Geography — climate, landforms, hydrology, ecology.
  • Human–environment relationships — the interface.
  • Regional Geography — deep study of specific regions.
slide 5

Geographic tools — GIS, RS, Cartography

Likely answer edit

Geographic tools.

  • GIS — Geographic Information Systems (digital spatial analysis).
  • Remote sensing — aerial photography and satellite imagery (this is the whole GPY 370 course).
  • Cartography — map-making.
slide 6

What do geographers do?

Likely answer edit

What geographers do. Collect and analyze data → detect spatial patterns → interpret those patterns in cultural, physical, economic, or historical context.

slide 7 (picture)

Pattern-interpretation exercise (US map)
Pattern-interpretation exercise (US map)
Likely answer edit

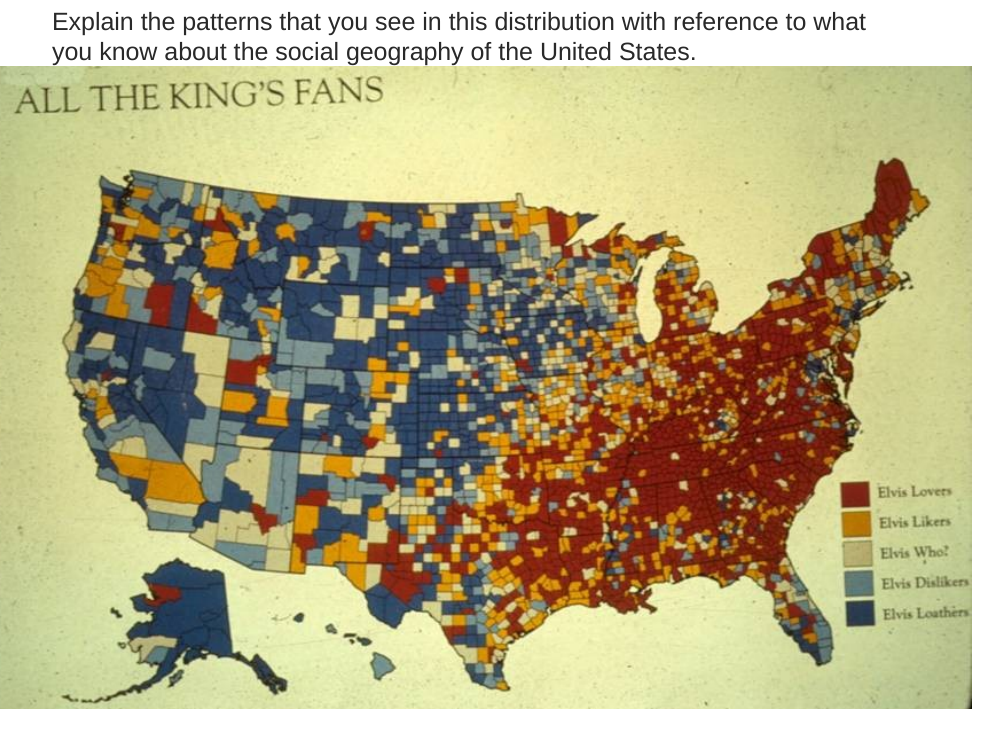
Pattern-interpretation exercise. The slide shows a map of the US and asks you to explain its pattern using what you know about US social geography. Classic pedagogical setup for the next three slides on scale and how it changes the pattern you see.

slide 8

Cartographic concepts — effects of scale

Likely answer edit

Cartographic concepts — scale matters.

  • “Effects of scale?” — the patterns visible in data change as you change map scale.
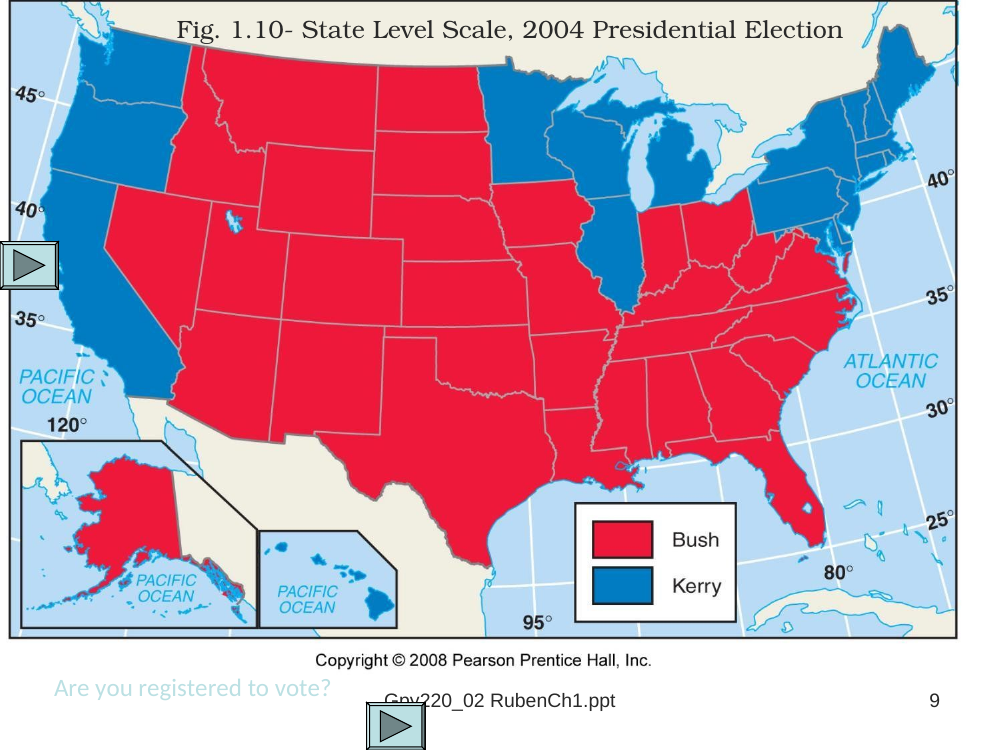
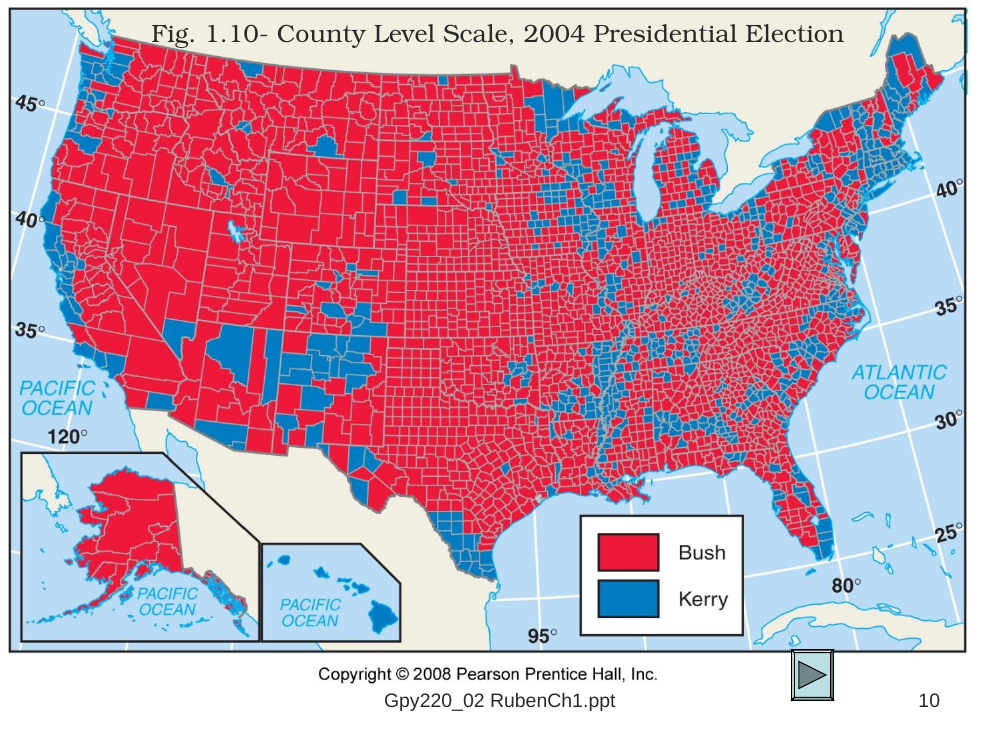
  • State vs. County — the coming slides contrast the same 2004 presidential election data at two scales.
  • Scale choice is never neutral — it encodes a political and analytical story.
slide 9 (picture)

State-level scale — 2004 election

State-level scale — 2004 election
Likely answer edit

Fig 1.10 — State-level scale, 2004 presidential election.

  • At the state level, the map looks like a clean Red/Blue binary — states go to Bush or Kerry.
  • This is the classic “red state / blue state” framing.
  • Slide also asks: “Are you registered to vote?” — standard civic nudge.
  • Context reference: Gpy220_02 RubenCh1.ppt.
slide 10 (picture)

County-level scale — same 2004 election
County-level scale — same 2004 election
Likely answer edit

Fig 1.10 — County-level scale, same 2004 election.

  • Same data at county resolution tells a much more nuanced story — both colors mixed throughout nearly every state, with urban/rural patterns emerging clearly.
  • Takeaway — the Modifiable Areal Unit Problem (MAUP). Aggregating data into different spatial units produces different patterns. Cartographic scale is a design choice with analytical consequences.
  • This is the payoff slide — it’s why geographers care about scale and why remote sensing at different resolutions (Landsat 30 m, MODIS 250 m, AVHRR 1 km) gives different answers to the same question.

Deck: WhatisGeographyGpy200Scale (1).ppt — 10 slides. Download original · Edit our reproduction